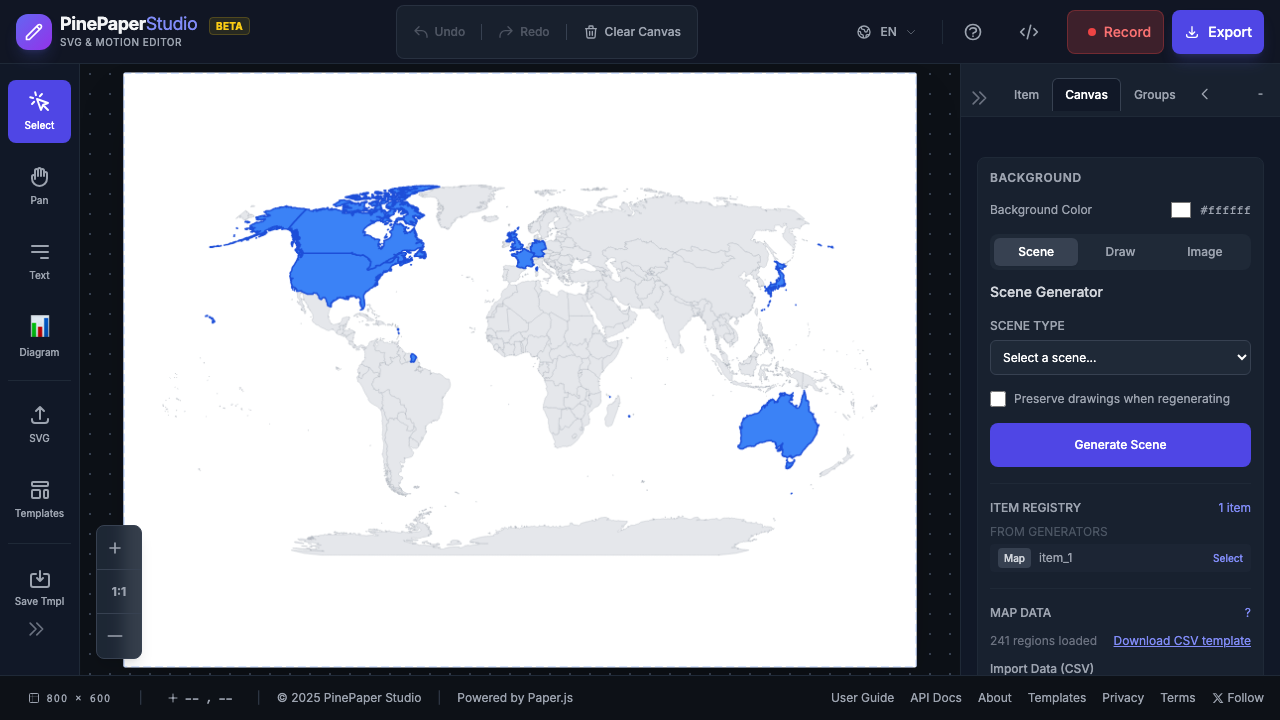
Map System
Create stunning geographic visualizations with interactive maps, choropleth data coloring, and animated reveals.
Overview
The Map System provides:
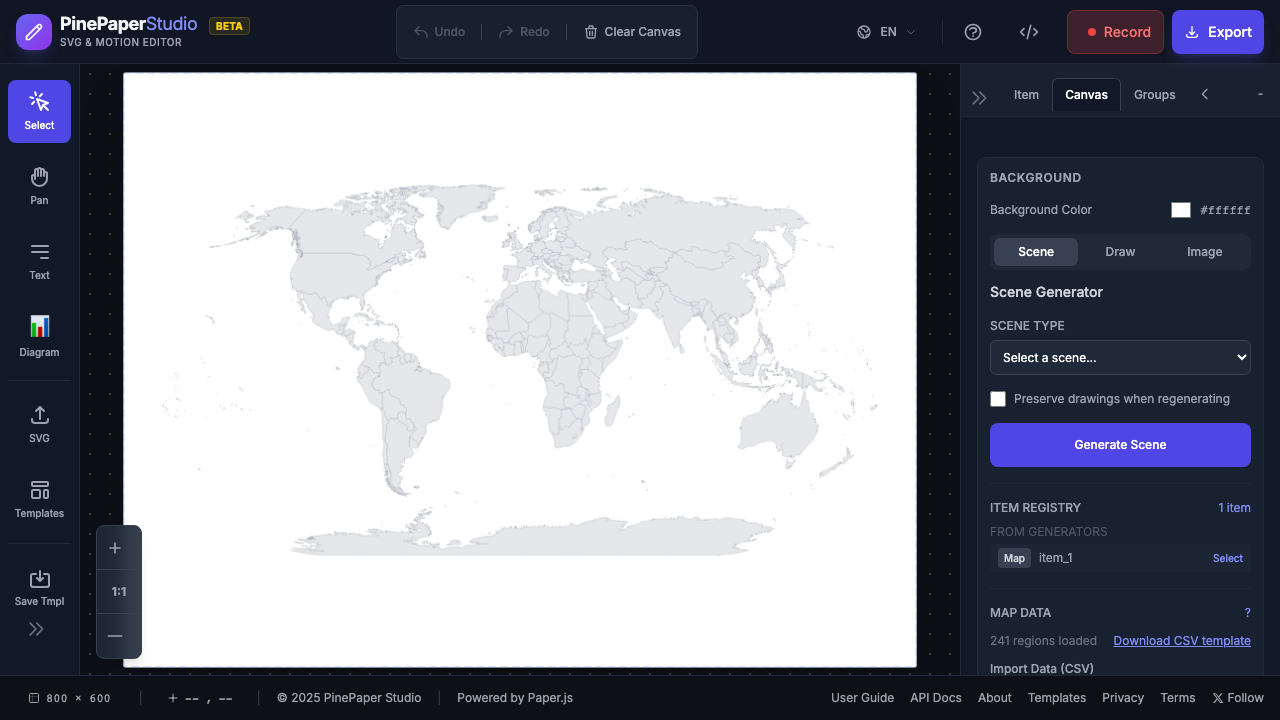
- World & Regional Maps — Pre-loaded maps from CDN (world, USA, Europe, etc.)
- Multiple Projections — Mercator, Natural Earth, Orthographic (globe), Albers, and more
- Region Highlighting — Highlight countries, states, or provinces
- Data Visualization — Choropleth maps with color scales
- Markers & Labels — Add points of interest
- Professional Quality — Multi-polygon support for complex countries
Loading a Map
From Templates
The easiest way to get started is using a map template:
- Open the Templates panel
- Find the Maps category
- Choose a template like “Global Expansion Map” or “US Data Visualization”
From Generator Panel
- Open the Generator panel
- Select Map as the background type
- Choose a map (World, USA, Europe, etc.)
- Configure projection and styling
Map Types
| Map | Description | Best For |
|---|---|---|
| world | World countries (110m resolution) | Quick world maps |
| worldHighRes | World countries (50m resolution) | Professional quality |
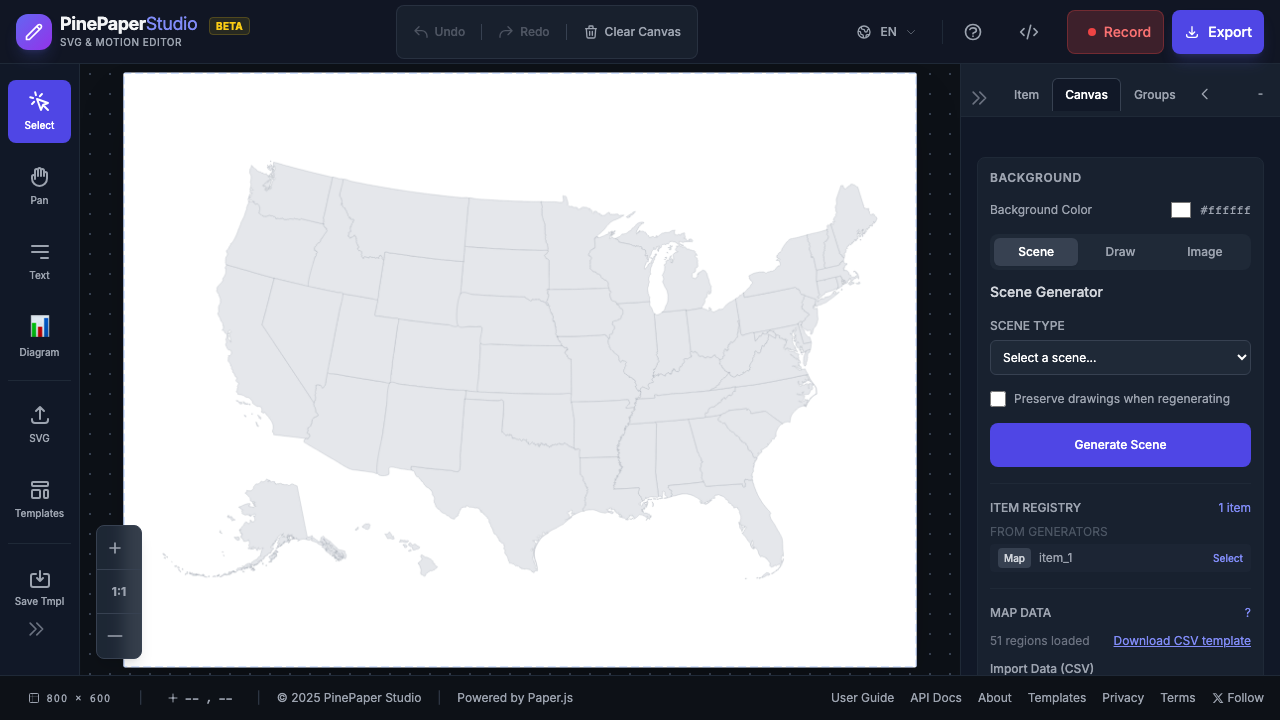
| usa | US states | State-level data |
| usaCounties | US counties | County-level data |
| europe | European countries | EU visualizations |
| canada | Canada only | Canadian data |
| africa | African countries | African data |
Projections
Choose the right projection for your visualization:
Natural Earth (Default)
Best for world maps. Balanced distortion, looks natural.
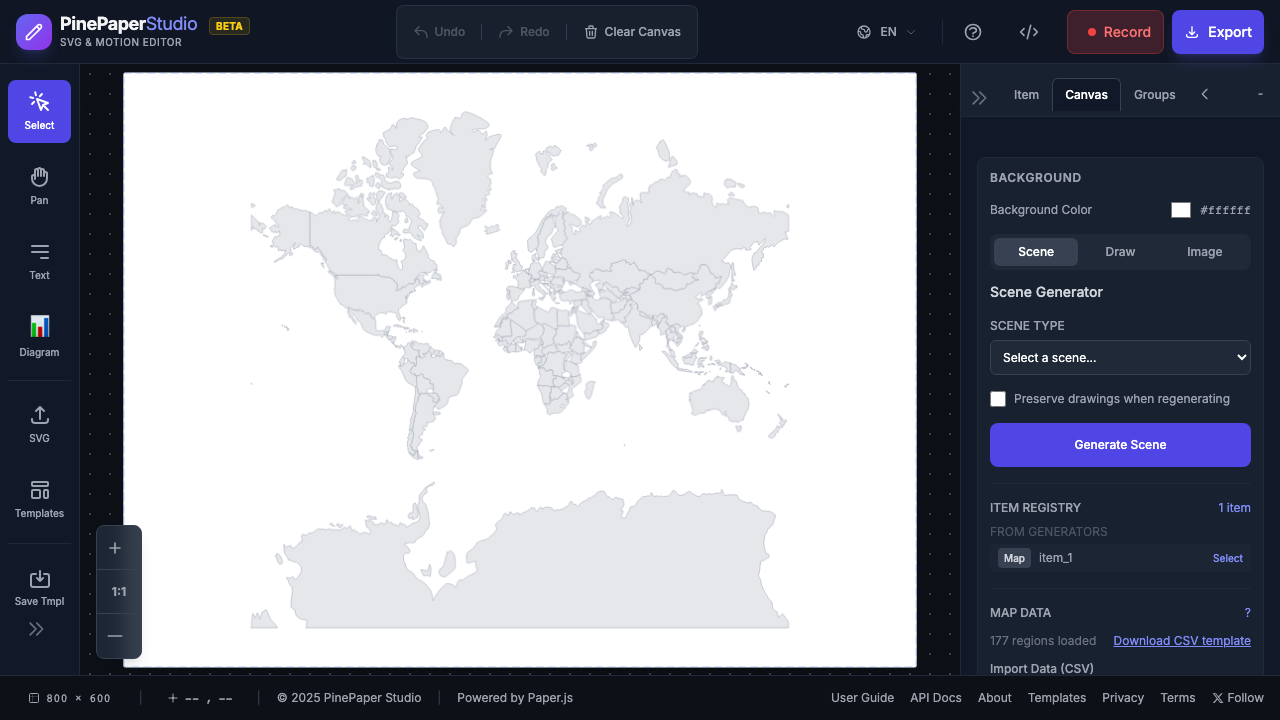
Mercator
Preserves angles, familiar look. Good for navigation-style maps.
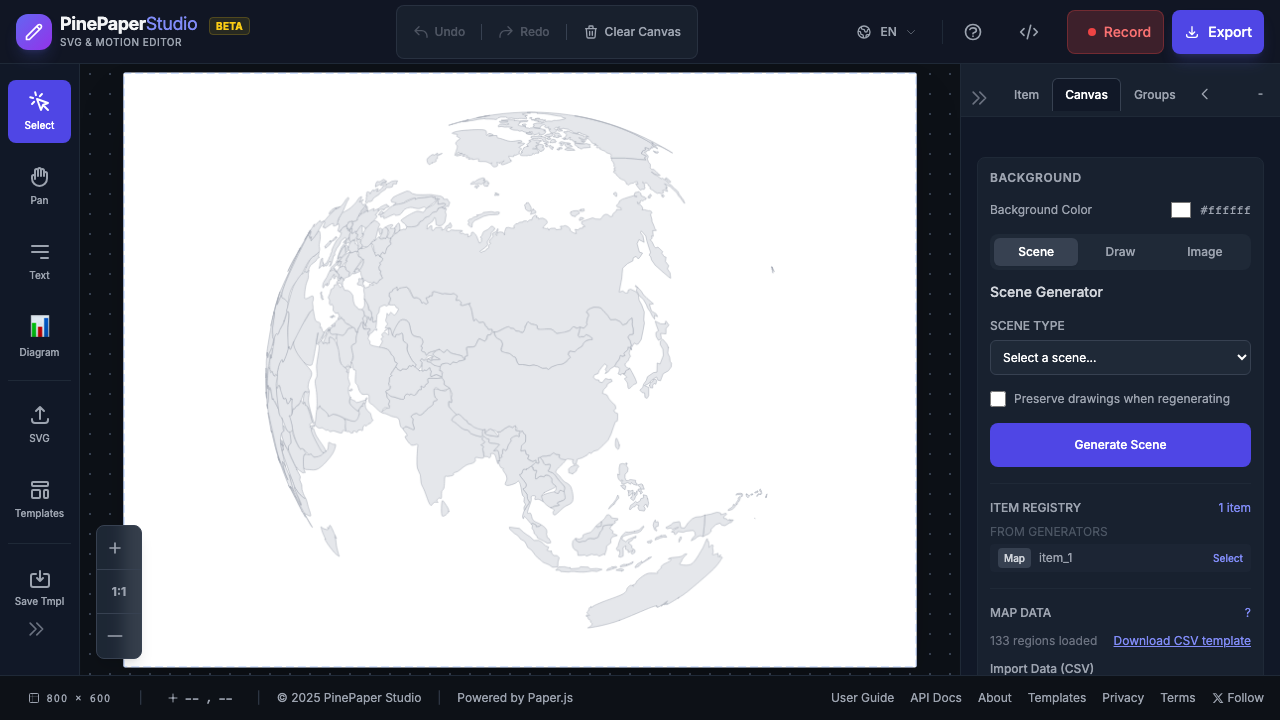
Orthographic (Globe)
Shows the Earth as a 3D sphere. Great for focused region views.
Albers USA
Special projection for US maps that includes Alaska and Hawaii repositioned.
Other Projections
- Robinson — Compromise projection, good for world maps
- Winkel Tripel — Low distortion world projection
- Conic Equal Area — Good for mid-latitude regions
Highlighting Regions
Single Country/State
Click on any region to select it, then use the Properties panel to change its color.
Multiple Regions
Use the API or templates to highlight multiple regions:
// Highlight North American countries
app.mapSystem.highlightRegions(
  ['United States of America', 'Canada', 'Mexico'],
  { fillColor: '#22c55e', strokeColor: '#16a34a' }
);
Animated Reveals
Templates can animate region highlights with staggered timing for storytelling effects.
Region ID Formats
Different maps use different ID formats:
| Map | ID Format | Examples |
|---|---|---|
| World maps | Full country names | “United States of America”, “France”, “Japan” |
| USA map | State names or codes | “California”, “CA”, “Texas”, “TX” |
Data Visualization (Choropleth)
Color regions based on data values:
app.mapSystem.applyDataColors({
  'California': 39538223,
  'Texas': 29145505,
  'Florida': 21538187
}, {
  colorScale: 'blues',
  showLegend: true,
  legendTitle: 'Population'
});
Color Scales
| Scale | Colors | Best For |
|---|---|---|
| blues | Light to dark blue | General data |
| greens | Light to dark green | Environmental data |
| reds | Light to dark red | Warning/negative data |
| heat | Yellow to red | Intensity data |
| purples | Light to dark purple | Qualitative data |
Markers
Add point markers at specific coordinates:
app.mapSystem.addMarker({
  lat: 37.7749,
  lon: -122.4194,
  label: 'San Francisco',
  color: '#ef4444',
  pulse: true  // Animated pulse effect
});
Quality Settings
| Quality | Simplification | Use Case |
|---|---|---|
| draft | High | Quick previews |
| standard | Moderate | Most uses |
| professional | None | Final exports, multi-polygon countries |
Important: Use professional quality for countries with complex shapes (Russia, France, USA) to ensure all territory parts render correctly.
Multi-Polygon Countries
Some countries consist of multiple disconnected parts:
- Russia — Mainland + Kaliningrad + islands
- France — Mainland + Corsica + overseas territories
- USA — Mainland + Alaska + Hawaii (in world maps)
- Indonesia — Thousands of islands
- Fiji — Multiple islands
The Map System automatically uses Paper.js CompoundPath for these countries when quality is set to professional.
Interactivity
Hover Effects
Enable hover highlighting:
app.mapSystem.loadMap('world', {
  enableHover: true,
  hoverFill: '#93c5fd'
});
Click Events
Respond to region clicks:
app.mapSystem.on('regionClick', (event) => {
  console.log('Clicked:', event.regionId);
  // Show info panel, highlight related regions, etc.
});
Map Templates
Global Expansion Map
Shows business expansion across regions with animated phase-based highlighting.
US Data Visualization
Displays data across US states with choropleth coloring.
Custom Map Import
For detailed regional maps not included, use importCustomMap():
// Load from GeoJSON
await app.mapSystem.importCustomMap(geoJsonData, {
  projection: 'mercator',
  idProperty: 'name'
});
Data Sources:
- Natural Earth — Public domain map data
- GADM — Detailed administrative boundaries
- Mapshaper — Simplify GeoJSON files
Tips
- Use worldHighRes for professional exports with multi-polygon countries
- Natural Earth projection works best for most world maps
- Albers USA is specifically designed for US maps
- Orthographic creates dramatic globe views for presentations
- Professional quality prevents shape corruption in complex countries
Keyboard Shortcuts
| Shortcut | Action |
|---|---|
| M | Toggle Map tool (when available) |
| Esc | Deselect all regions |
Map Region Animation
Animate map regions with timeline-integrated color changes. Perfect for showing data changes over time, global expansion sequences, or creating engaging data visualizations.
Basic Region Animation
Animate specific regions with keyframe-based color transitions:
// Load a world map first
await app.loadMap('world', {
  projection: 'naturalEarth',
  fillColor: '#e2e8f0'
});

// Animate specific regions
app.animateMapRegions({
  duration: 5,
  loop: true,
  regions: {
    'USA': [
      { time: 0, fillColor: '#ef4444' },      // Red at start
      { time: 2.5, fillColor: '#22c55e' },    // Green at midpoint
      { time: 5, fillColor: '#ef4444' }       // Red at end (loops)
    ],
    'France': [
      { time: 0, fillColor: '#3b82f6' },      // Blue at start
      { time: 5, fillColor: '#fbbf24' }       // Yellow at end
    ]
  }
});
Wave Animation
Create a wave of color across all regions based on geographic position:
app.animateMapWave({
  duration: 10,
  loop: true,
  colors: ['#ef4444', '#fbbf24', '#22c55e', '#3b82f6'],
  waveDirection: 'horizontal'  // 'horizontal', 'vertical', 'radial'
});
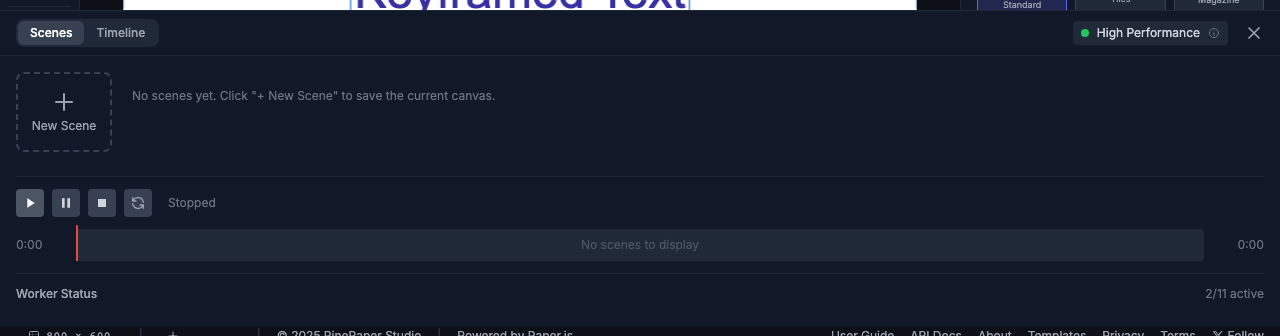
Timeline Integration
Animated regions integrate with the Timeline UI:
- Animated regions appear in the Timeline panel
- Scrub through time to preview color changes
- Play/pause animations with the timeline controls
- Export animations to video or GIF
Stopping Animations
// Stop all region animations
app.stopMapAnimations();

// Stop specific regions
app.stopMapAnimations({ regions: ['USA', 'Canada'] });

// Stop but preserve current colors
app.stopMapAnimations({ resetColors: false });
Getting Animated Regions
const animated = app.getAnimatedMapRegions();
// Returns: [{ regionId, keyframes, duration, loop }, ...]
CSV Export & Import
Export and import region data including colors, highlight status, and selection state for data-driven visualizations.
Exporting Region Data
// Export all regions with current state
const csv = app.exportMapRegionDataCSV();

// Export with custom options
const csv = app.exportMapRegionDataCSV({
  includeHighlighted: true,  // Include highlight status column
  includeSelected: true,     // Include selection status column
  includeColors: true        // Include fill/stroke colors
});

// Download directly as CSV file
app.downloadMapRegionDataCSV('my-map-data.csv');
CSV Format:
regionId,name,highlighted,selected,fillColor,strokeColor
USA,United States of America,1,0,#22c55e,#16a34a
CAN,Canada,0,0,#e5e7eb,#9ca3af
FRA,France,1,1,#3b82f6,#2563eb
Importing Region Data
Import CSV data to update region states:
// Import from CSV text
app.importMapRegionDataCSV(csvText, {
  applyColors: true,      // Apply fill/stroke colors from CSV
  applyHighlight: true,   // Update highlight status
  applySelection: true    // Update selection status
});
Programmatic Selection
// Select regions programmatically
app.selectMapRegions(['USA', 'Canada', 'Mexico']);

// Deselect regions
app.deselectMapRegions(['Mexico']);

// Get highlighted regions
const highlighted = app.getHighlightedMapRegions();
// Returns: ['USA', 'France', ...]
Workflow: Spreadsheet-Based Map Editing
- Load a map and highlight some regions
- Export to CSV:
app.downloadMapRegionDataCSV('regions.csv') - Edit in Excel/Google Sheets (change colors, set highlighted=1)
- Import back:
app.importMapRegionDataCSV(updatedCsv)
This workflow is ideal for:
- Non-technical users editing map data
- Bulk updates to many regions
- Data pipeline integration
- Version-controlled map configurations
GeoJSON Export & Import
Export maps as GeoJSON for editing in external tools like QGIS or Mapshaper, then re-import with your modifications.
Export Modified Map
Export the map with current colors and styles:
// Export as GeoJSON (includes current colors/styles)
const geoJson = app.exportMapGeoJSON();

// Download directly
app.downloadMapGeoJSON('my-styled-map.geojson');
Export Original Source
Download the exact GeoJSON that was used to load the map (unmodified boundaries):
// Get original source data
const original = app.getOriginalMapGeoJSON();

// Download for external editing
app.downloadOriginalMapGeoJSON('world-source.geojson');
Import Custom Maps
Import your edited GeoJSON or external map data:
// Import from URL
await app.importCustomMap('https://example.com/my-map.geojson');

// Import from object
await app.importCustomMap(editedGeoJson, {
  projection: 'naturalEarth'
});
Full Workflow: Edit → Re-import → Animate
-
Load and export the original map:
await app.loadMap('world'); app.downloadOriginalMapGeoJSON('world-source.geojson'); -
Edit boundaries in external tools:
- QGIS - Full-featured GIS editor
- Mapshaper - Online simplification and editing
- geojson.io - Quick online editor
-
Re-import your edited map:
await app.importCustomMap(editedGeoJson, { projection: 'naturalEarth' }); -
Animate your custom map:
app.animateMapRegions({
  duration: 5,
  regions: { 'MyRegion': [{ time: 0, fillColor: '#ef4444' }, ...] }
});
Map Source Info
Get information about the currently loaded map:
const info = app.getMapSourceInfo();
// {
//   source: 'world',
//   projection: 'naturalEarth',
//   quality: 'standard',
//   regionCount: 177,
//   hasOriginalGeoJSON: true,
//   isCustomImport: false
// }
External Resources
Map Data Sources
| Source | Description | Best For |
|---|---|---|
| Natural Earth | Free public domain map data at multiple scales | World maps, quick projects |
| GADM | High-quality administrative boundaries | Country subdivisions, detailed regions |
| OpenStreetMap | Community-maintained, highly detailed | City-level data, roads, buildings |
| US Census TIGER | Official US boundaries | US states, counties, tracts |
| Eurostat | Official EU boundaries | European countries and regions |
Conversion & Editing Tools
| Tool | Description | Link |
|---|---|---|
| Mapshaper | Online tool for simplifying and converting maps | mapshaper.org |
| geojson.io | Quick online GeoJSON editor | geojson.io |
| QGIS | Full-featured desktop GIS (free) | qgis.org |
| ogr2ogr | Command-line format converter | Part of GDAL |
Format Conversion Workflow
Shapefile → GeoJSON (using Mapshaper):
- Go to mapshaper.org
- Drag and drop your
.shpfile (along with.dbfand.prjfiles) - Click Simplify to reduce file size (use 10-20% for web)
- Click Export → choose GeoJSON
- Import into PinePaper with
app.importCustomMap()
TopoJSON → GeoJSON:
TopoJSON files are automatically converted when imported into PinePaper.
File Size Tips
| Original Size | Recommended Action |
|---|---|
| < 1 MB | Use directly |
| 1-5 MB | Simplify to 50% in Mapshaper |
| 5-20 MB | Simplify to 10-20% |
| > 20 MB | Consider using a smaller region or higher simplification |
API Reference
For programmatic map control, see the Map System API Documentation.